In part 1 I setup a script to load test our Citrix Storefront server, as a user logging in through the website. Part 2 was users connecting via PNA. In this part I’m going to examine our existing load. In order to do so, I only want to count the following users:
- Users must have logged into Web Interface. This ensures that we count users who have actually logged in to launch an application. Some of our users may have the Web Interface set as their homepage so this way we can avoid idle user counts.
- Users who have launched an application. I’m interested in the users who have actually launched an application via Web Interface.
- PNA connections
- PNA launches
I want to get these user counts sorted via time in order to determine our peak load.
To get these counts I decided to key into some unique web URL’s or resources. For #1, I decided to search the IIS logs for the “Logoff.png”.
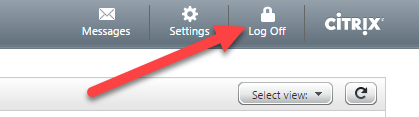
This icon will only be pulled down for a user who has logged into the Web Interface.
For #2, I decided to look at the IIS logs and search for “launch.ica”. This will get us the application launches via the sites.
![]()
For #3, I decided to look at the IIS logs and search for “config.xml”. This file is pulled each time PNA is launched or a user logs onto the machine.
For #4, I decided to look at the IIS logs and search for “launch.aspx”.
##
Users must have logged into Web Interface.
For #1 I created a powershell script to parse the IIS log file and export my data:
# Define the location of log files and a temporary file
$LogFolder = "\\web01.bottheory.local\d$\inetpub\logs\LogFiles\W3SVC1"
$LogFiles = [System.IO.Directory]::GetFiles($LogFolder, "*.log")

#properties for stats to export to CSV

$obj = [System.Collections.ArrayList]::new()


function getElements ($date, $URI) {

$array = @()
$prop = New-Object System.Object
$prop | Add-Member -type NoteProperty -name "DateTime" -value $date
$prop | Add-Member -type NoteProperty -name "URI" -value $URI
$array = @($prop)
$obj.addrange($array)
}

foreach ($LogFile in $LogFiles) {
[Console]::WriteLine("$(Get-Date) $LogFile") #performance optimization from Microsoft
 try
 {
 $stream = [System.IO.StreamReader]::new($LogFile)
 while ($line = $stream.ReadLine())
 {
 if ($line[0] -eq "#") {continue}
 $data = $line.Split(" ")

 #write-host "0: $($data[0]) 1: $($data[1]) 2: $($data[2]) 3: $($data[3]) 4: $($data[4]) 5: $($data[5]) 6: $($data[6]) 7: $($data[7]) 8: $($data[8]) 9: $($data[9]) 10: $($data[10])"  ##uncomment "write-host" to see data

 #$data[4]
 if ($data[4] -like "*Logoff.png*") {
 $iisdateTime = "$($data[0]) $($data[1])"
 $iisdateTime = [datetime]$iisdateTime
 $iisdateTime = $iisdateTime.addHours(-7)  #fix up GMT-0 to my timezone
 getElements $iisdateTime $data[4]
 }

 #$data[4]
 if ($data[4] -like "*launch.ica*") {
 $iisdateTime = "$($data[0]) $($data[1])"
 $iisdateTime = [datetime]$iisdateTime
 $iisdateTime = $iisdateTime.addHours(-7) #fix up GMT-0 to my timezone
 getElements $iisdateTime $data[4]
 }
 #write-host $iisdateTime


 #pause
 }
 }
 finally
 {
 $stream.Dispose()
 }
}

$obj| export-csv WebInterface.cs
I then opened it in Excel and created time ranges per-hour and then counted how many of each item was found in that range. For the Logoff.PNG it was accessed like this:
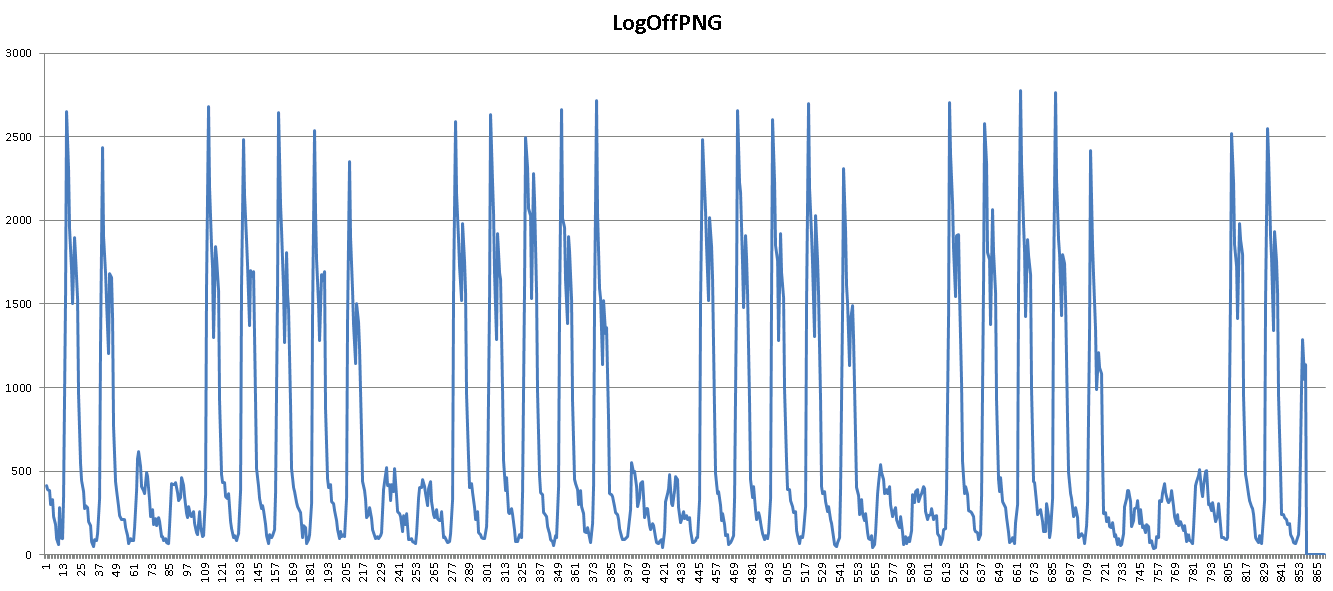
The peak count was 2775 logons over a course of an hour. This equals ~45 logons per minute or 1 logon every 1.29 seconds.
In order to get even more precise, I broke down the hour that had the 2775 logons and looked at how many logons occurred over 15 minute time spans.
The peak rate over a 15 min span was:
1 logon every 0.974 second. (1.02 logons per second)
Users who have launched an application
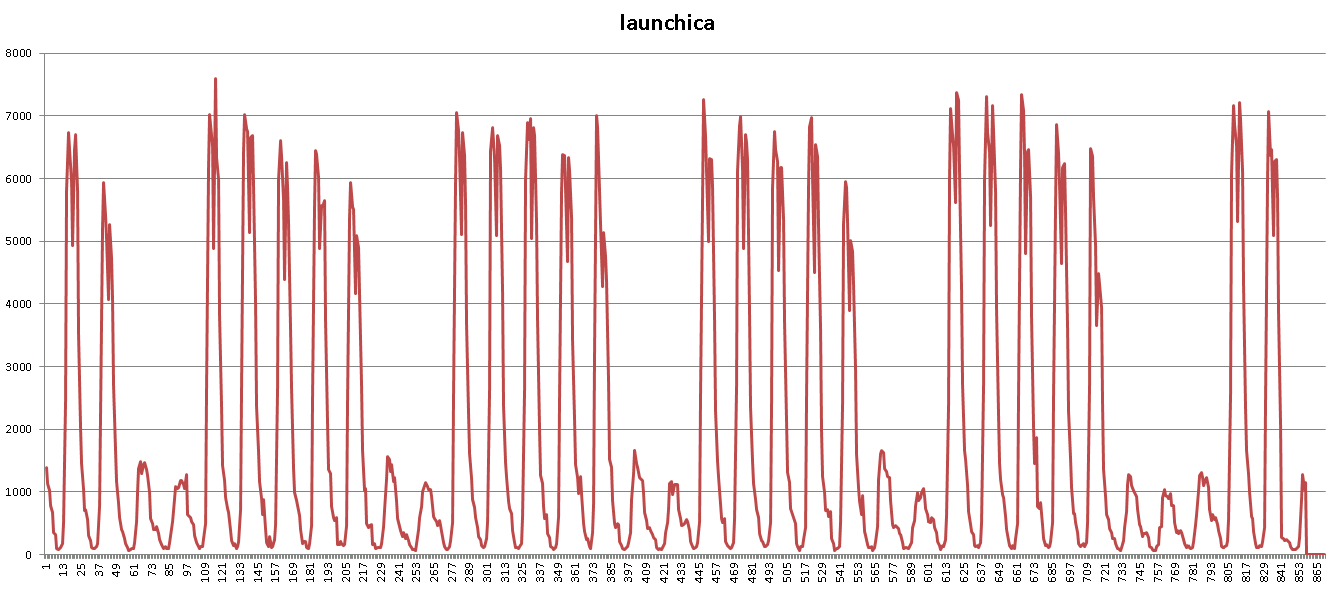
For users who launch an application we are at 7593 launches as a peak over an hour.
The peak access to Web Interface is 2.10 launches per second.
If we do a failover strategy to ensure , say in the future, we unified our architecture to a single location (or single cloud?) what would our combined rate be?
1 launch every 0.561 second. (1.78 launches per second)
Citrix has Storefront guidance that says it can handle connections/users in the ten’s of thousands. I thought we were a large organization, but apparently Storefront has been designed for something even bigger! (Or web-based front ends are rarely the bottle neck…)
So these numbers are purely for logons through the web site. But previous testing for PNA functionality showed that it’s a *much* heavier traffic to Web Interface. Why is the traffic heavier for PNA? Because each time a user logs on to a workstation it kicks in. Whereas accessing the web interface requires some work the user must do, PNA is automatic. It’s also more convenient for users as they prefer to launch desktop/start menu icons.
PNA connections
How am I going to determine our concurrent connection rate for PNA? This is what a PNA connection looks like:
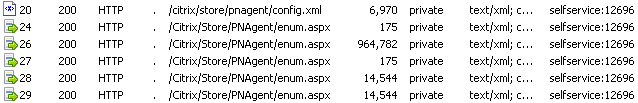
What I’m going to do is query the IIS logs for ‘config.xml’, as that file gets called only once when Receiver is launched or upon login. Once I get that I can search for ‘enum.aspx’ command that has been called and divide by the number of config.xml’s. This should get me the number of icon requests per user.
After doing the math I found Receiver makes 2.63 enum.aspx request for every config.xml requests.
Lastly,
My thought process here is once we get our peak ‘Receiver’ connection rate to the Storefront server we can create another script to simulate it. I know WCAT can do this as no funny cookie business occurs for Receiver.
So what does the PNA Receiver numbers look like?
We have a peak PNA connection rate of 7.531 config.xml connections per second. Multiplying by the additional 2.63 enum.aspx requests give us a total of 19.806 connections per second for a peak rate.
For PNA application launches, our peak rate is 30,075 launches in a single hour. This was measured by parsing for “launch.aspx”. Breaking this hour down to 15 minute intervals and a single 15min window contained 53% of the launches. For our peak 15 minute window this is 16148 launches. This gives us a total of 17.94 application launches per second.
| Peak Rates | (in per second) | ||||
| PNA Logons | PNA App Launches | Web Logons | Web LaunchICA | Connections per second | |
| 7.531 | 17.94 | 1.02 | 1.78 | 28.271 |