In looking at the performance of the Citrix Storefront Server, one of the thing I want is to understand what Storefront is doing at each stage of a session life cycle. There are two session-types that I’m curious about, a web browser based connection and a PNA connection. I’m going to examine a web browser based connection first.
Using my powershell script to simulate a user connection I put ‘pauses’ between each stage. I then setup Perfmon to capture counters from the following objects:
Citrix Dazzle Resources Controller\Image Response Whole Body  Calls / second
Citrix Dazzle Resources Controller\Image Response Whole Body Average Time (Microseconds)
Citrix Dazzle Resources Controller\List Sessions Whole Body  Calls / second
Citrix Dazzle Resources Controller\List Sessions Whole Body Average Time (Microseconds)
Citrix Dazzle Resources Controller\List Whole Body  Calls / second
Citrix Dazzle Resources Controller\List Whole Body Average Time (Microseconds)
Citrix Dazzle Resources Controller\ListWithoutAutoProvision Whole Body  Calls / second
Citrix Dazzle Resources Controller\ListWithoutAutoProvision Whole Body Average Time (Microseconds)
Citrix Dazzle Resources Controller\Update Resources Image Cache  Calls / second
Citrix Dazzle Resources Controller\Update Resources Image Cache Average Time (Microseconds)
Citrix Delegated Kerberos Authentication\Authenticate  Calls / second
Citrix Delegated Kerberos Authentication\Authenticate Average Time (Microseconds)
Citrix Delivery Services Web Application(authservice:tokenservices:post:_citrix_authentication)\Controller Action  Calls / second
Citrix Delivery Services Web Application(authservice:tokenservices:post:_citrix_authentication)\Controller Action Average Time (Microseconds)
Citrix Delivery Services Web Application(citrixfederationauthentication:authenticate:post:_citrix_authentication)\Controller Action  Calls / second
Citrix Delivery Services Web Application(citrixfederationauthentication:authenticate:post:_citrix_authentication)\Controller Action Average Time (Microseconds)
Citrix Delivery Services Web Application(dazzleresources:launchica:post:_citrix_store)\Controller Action  Calls / second
Citrix Delivery Services Web Application(dazzleresources:launchica:post:_citrix_store)\Controller Action Average Time (Microseconds)
Citrix Delivery Services Web Application(dazzleresources:list:get:_citrix_store)\Controller Action  Calls / second
Citrix Delivery Services Web Application(dazzleresources:list:get:_citrix_store)\Controller Action Average Time (Microseconds)
Citrix Delivery Services Web Application(endpoints:endpoints:get:_agservices)\Controller Action  Calls / second
Citrix Delivery Services Web Application(endpoints:endpoints:get:_agservices)\Controller Action Average Time (Microseconds)
Citrix Delivery Services Web Application(endpoints:endpoints:get:_citrix_authentication)\Controller Action  Calls / second
Citrix Delivery Services Web Application(endpoints:endpoints:get:_citrix_authentication)\Controller Action Average Time (Microseconds)
Citrix Delivery Services Web Application(endpoints:endpoints:get:_citrix_configuration)\Controller Action  Calls / second
Citrix Delivery Services Web Application(endpoints:endpoints:get:_citrix_configuration)\Controller Action Average Time (Microseconds)
Citrix Delivery Services Web Application(endpoints:endpoints:get:_citrix_roaming)\Controller Action  Calls / second
Citrix Delivery Services Web Application(endpoints:endpoints:get:_citrix_roaming)\Controller Action Average Time (Microseconds)
Citrix Delivery Services Web Application(endpoints:endpoints:get:_citrix_store)\Controller Action  Calls / second
Citrix Delivery Services Web Application(endpoints:endpoints:get:_citrix_store)\Controller Action Average Time (Microseconds)
Citrix Delivery Services Web Application(protocols:choices:post:_citrix_authentication)\Controller Action  Calls / second
Citrix Delivery Services Web Application(protocols:choices:post:_citrix_authentication)\Controller Action Average Time (Microseconds)
Citrix Delivery Services Web Application(selfserviceaccountmanagement:allowselfserviceaccountmanagement:get:_citrix_authentication)\Controller Action  Calls / second
Citrix Delivery Services Web Application(selfserviceaccountmanagement:allowselfserviceaccountmanagement:get:_citrix_authentication)\Controller Action Average Time (Microseconds)
Citrix Delivery Services Web Application(tokenvalidation:tokenvalidation:get:_citrix_authentication)\Controller Action  Calls / second
Citrix Delivery Services Web Application(tokenvalidation:tokenvalidation:get:_citrix_authentication)\Controller Action Average Time (Microseconds)
Citrix Receiver for Web\Get Ica file  Calls / second
Citrix Receiver for Web\Get Ica file Average Time (Microseconds)
Citrix Receiver for Web\Get icon  Calls / second
Citrix Receiver for Web\Get icon Average Time (Microseconds)
Citrix Receiver for Web\Get launch status  Calls / second
Citrix Receiver for Web\Get launch status Average Time (Microseconds)
Citrix Receiver for Web\List resources  Calls / second
Citrix Receiver for Web\List resources Average Time (Microseconds)
Citrix Receiver for Web\Login attempts  Calls / second
Citrix Receiver for Web\Login attempts Average Time (Microseconds)
Citrix Resources Common\Find all resources  Calls / second
Citrix Resources Common\Find all resources Average Time (Microseconds)
Citrix Resources Common\Find resource by id  Calls / second
Citrix Resources Common\Find resource by id Average Time (Microseconds)
Citrix Resources Common\ICA Launch  Calls / second
Citrix Resources Common\ICA Launch Average Time (Microseconds)
Citrix Xml Service Communication(10.10.10.11)\Network Traffic  Calls / second
Citrix Xml Service Communication(10.10.10.11)\Network Traffic Average Time (Microseconds)
Citrix Xml Service Communication(10.10.10.12)\Network Traffic  Calls / second
Citrix Xml Service Communication(10.10.10.12)\Network Traffic Average Time (Microseconds)
Citrix Xml Service Communication(10.10.10.13)\Network Traffic  Calls / second
Citrix Xml Service Communication(10.10.10.13)\Network Traffic Average Time (Microseconds)
Citrix Xml Service Communication(10.10.10.14)\Network Traffic  Calls / second
Citrix Xml Service Communication(10.10.10.14)\Network Traffic Average Time (Microseconds)
Citrix Xml Service Communication(&5.bottheory.local)\Network Traffic  Calls / second
Citrix Xml Service Communication(&5.bottheory.local)\Network Traffic Average Time (Microseconds)
Citrix Xml Service Communication(XenApp65t.bottheory.local)\Network Traffic  Calls / second
Citrix Xml Service Communication(XenApp65t.bottheory.local)\Network Traffic Average Time (Microseconds
I’ve added 6 farms to the storefront server to examine the load “in a real world” environment as Storefront does do some magic with concurrent enumeration. What I love that Citrix has done, is actually time the transactions AND gives you the ‘rate’ the transactions are occurring at. This will make it much easier to baseline what your load is vs how I had to do it to measure the ‘rates’ for Web Interface.
$stage = “Initial Connection”
$store = “http://storefront.bottheory.local/Citrix/StoreWeb/”
So for a web browser based connection, I ‘connected’ to the site and saw nothing. Storefront does very little work for the initial connection.
$stage = “Client Configuration”
$store + “Home/Configuration”
Result:
<clientSettings
	xmlns='http://citrix.com/delivery-services/webAPI/2-6/clientConfig'>
	<session timeout="600" />
	<authManager getUsernameURL="Authentication/GetUserName" logoffURL="Authentication/Logoff" changeCredentialsURL="ExplicitAuth/GetChangeCredentialForm" loginFormTimeout="5" webviewReturnURL="ExplicitAuth/Bounce" webviewResumeURL="ExplicitAuth/ResumeForms" allowSelfServiceAccountManagementURL="ExplicitAuth/AllowSelfServiceAccountManagement" />
	<storeProxy keepAliveURL="Home/KeepAlive">
		<resourcesProxy listURL="Resources/List" resourceDetails="default" />
		<sessionsProxy listAvailableURL="Sessions/ListAvailable" disconnectURL="Sessions/Disconnect" logoffURL="Sessions/Logoff" />
		<clientAssistantProxy getDetectionTicketURL="ClientAssistant/GetDetectionTicket" getDetectionStatusURL="ClientAssistant/GetDetectionStatus" />
	</storeProxy>
	<pluginAssistant enabled="true" upgradeAtLogin="false" showAfterLogin="false">
		<win32 path="http://downloadplugins.citrix.com/Windows/CitrixReceiverWeb.exe" />
		<macOS path="http://downloadplugins.citrix.com/Mac/CitrixReceiverWeb.dmg" minimumSupportedOSVersion="10.6" />
		<html5 enabled="Fallback" platforms="Firefox;Chrome;Version/([6-9]|\d\d).*Safari;MSIE \d\d;Trident/([6-9]|\d\d);Android;iPad;iPhone;iPod;" launchURL="clients/HTML5Client/src/SessionWindow.html" preferences="" singleTabLaunch="false" chromeAppOrigins="chrome-extension://haiffjcadagjlijoggckpgfnoeiflnem" chromeAppPreferences="" />
		<protocolHandler enabled="true" platforms="(Macintosh|Windows NT).*((Firefox/((5[3-9]|[6789][0-9])|\d\d\d))|(Chrome/((4[2-9]|[56789][0-9])|\d\d\d)))(?!.*Edge)" skipDoubleHopCheckWhenDisabled="false" />
	</pluginAssistant>
	<userInterface autoLaunchDesktop="true" multiClickTimeout="3" enableAppsFolderView="true">
		<workspaceControl enabled="true" autoReconnectAtLogon="true" logoffAction="disconnect" showReconnectButton="true" showDisconnectButton="true" />
		<receiverConfiguration enabled="true" downloadURL="ServiceRecord/GetDocument/receiverconfig.cr" />
		<uiViews showDesktopsView="true" showAppsView="true" defaultView="auto" />
		<appShortcuts enabled="false" allowSessionReconnect="true" />
	</userInterface>
	<featureToggles>
		<feature name="Citrix.DeliveryServices.WingImpl.AlwaysOnTracing" enabled="True" />
		<feature name="Citrix.DeliveryServices.DazzleResources.Web.AlwaysOnTracing" enabled="True" />
		<feature name="Citrix.DeliveryServices.DazzleResourcesController.AnonymousPrelaunch" enabled="True" />
		<feature name="Citrix.StoreFront.Roaming.NetScalerConfiguration" enabled="True" />
		<feature name="Citrix.DeliveryServices.Admin.NetScalerImport" enabled="True" />
		<feature name="Citrix.DeliveryServices.WebUI.ClientDetection.IfRequiredByApps" enabled="True" />
		<feature name="Citrix.DeliveryServices.WebUI.WebviewCredentialSupport" enabled="True" />
		<feature name="Citrix.DeliveryServices.ZonePreference" enabled="True" />
		<feature name="Citrix.StoreFront.Authentication.Saml" enabled="True" />
		<feature name="Citrix.StoreFront.AuthenticationToken.Jwt" enabled="False" />
		<feature name="Citrix.StoreFront.Authentication.Cloud" enabled="False" />
		<feature name="Citrix.StoreFront.XenMobile.SmartAccess" enabled="True" />
		<feature name="Citrix.DeliveryServices.Authentication.SelfServiceAccountManagement" enabled="True" />
		<feature name="Citrix.StoreFront.MultipleIISWebsites" enabled="True" />
		<feature name="Citrix.DeliveryServices.HdxOverUdp" enabled="True" />
		<feature name="Citrix.StoreFront.WebAndSaaSApps" enabled="False" />
		<feature name="StoreFrontCloudAdmin" enabled="False" />
		<feature name="StoreFrontCloudDeployment" enabled="False" />
		<feature name="StoreFrontGWaaS_Product_RestrictPop" enabled="False" />
		<feature name="StoreFrontMultiTenantBrokerService" enabled="False" />
	</featureToggles>
</clientSettings>
This request is to get the client configuration. Essentially, it pulls down an xml file from the store containing important links to various locations in Storefront. Again, no perf counter seems to occur and it doesn't seem to generate any load.
$stage = “Get Authentication Methods”
$store + “Resources/List”
<#
https://citrix.github.io/storefront-sdk/requests/#authentication-methods
Note
The client must first make a POST request to /Resources/List. Since the user is not yet authenticated, this returns a challenge in the form of a CitrixWebReceiver- Authenticate header with the GetAuthMethods URL in the location field.
#
So this command starts to get a little exciting. It's a bit of a misnomer to call it "Resources/List" as it doesn't actually return resources, yet. It returns the challenge to logon. We get our first Peformance Counter hit.
The four counters that register are
Citrix Receiver for Web\List resources Calls / second
Citrix Receiver for Web\List resources Average Time (microseconds)
Citrix Delivery Services Web Application(dazzleresources:list:get:_citrix_store)\Controller Action Calls / second
Citrix Delivery Services Web Application(dazzleresources:list:get:_citrix_store)\Controller Action Average Time (Microseconds)
Results:
List resources Calls / second: 1
List resources Average Time (microseconds): 3,714
(dazzleresources:list:get:_citrix_store)\Controller Action Average Time (Microseconds): 607
(dazzleresources:list:get:_citrix_store)\Controller Action Calls / second: 1
$stage = “Get Auth Methods”
$store + “Authentication/GetAuthMethods”
Response:
<authMethods xmlns="http://citrix.com/delivery-services/webAPI/2-6/authMethods">

    <method name="ExplicitForms" url="ExplicitAuth/Login"/>

    <method name="IntegratedWindows" url="DomainPassthroughAuth/Login"/>

    <method name="CitrixAuth" url="CitrixAuth/Login"/>

</authMethods>
Another exciting call. This call hits these four performance counters:
Citrix Delivery Services Web Application(authservice:tokenservices:post:_citrix_authentication)\Controller Action Calls / second
Citrix Delivery Services Web Application(authservice:tokenservices:post:_citrix_authentication)\Controller Action Average Time (Microseconds)
Citrix Delivery Services Web Application(protocols:choices:post:_citrix_authentication)\Controller Action Calls / second
Citrix Delivery Services Web Application(protocols:choices:post:_citrix_authentication)\Controller Action Average Time (Microseconds)
Results:
(protocols:choices:post:_citrix_authentication)\Controller Action Calls / second: 1
(protocols:choices:post:_citrix_authentication)\Controller Action Average Time (Microseconds) : 488
(authservice:tokenservices:post:_citrix_authentication)\Controller Action Calls / second: 1
(authservice:tokenservices:post:_citrix_authentication)\Controller Action Average Time (Microseconds): 138
The Controller Action Calls /second was "1", obviously I'm doing just a single test. For the action average time I got 711 microseconds. Extremely fast.
$stage = “Domain Pass-Through and Smart Card Authentication”
$store + “DomainPassthroughAuth/Login”
Response:
<?xml version="1.0" encoding="UTF-8"?>
<AuthenticationStatus xmlns="http://citrix.com/delivery-services/webAPI/2-6/authStatus">
  <Result>success</Result>
  <AuthType>IntegratedWindows</AuthType>

</AuthenticationStatus
Two more perf counters hit (rate + time):
Citrix Delivery Services Web Application(citrixfederationauthentication:authenticate:post:_citrix_authentication)\Controller Action Calls / second
Citrix Delivery Services Web Application(citrixfederationauthentication:authenticate:post:_citrix_authentication)\Controller Action Average Time (Microseconds)
Results:
(citrixfederationauthentication:authenticate:post:_citrix_authentication)\Controller Action Calls / second: 1
(citrixfederationauthentication:authenticate:post:_citrix_authentication)\Controller Action Average Time (Microseconds): 4,850
$stage = “Resource Enumeration”
$store + “Resources/List”
Response:
{
	"isSubscriptionEnabled": true,
	"isUnauthenticatedStore": false,
	"resources": [
		{
			"clienttypes": [
				"ica30",
				"rdp"
			],
			"description": "MS Access 2010",
			"iconurl": "Resources/Icon/L0NpdHJpeC9TdG9yZS9yZXNvdXJjZXMvdjIvUVRkRE1EZzFORFUwTVVaRE5UZzJSVEkyTVVOQ09ETTFPRU5CUVRRMk5qUTFOakZCTmtZME1nLS0vaW1hZ2U-?size=128",
			"id": "CTX65.Office - Access 2010",
			"launchstatusurl": "Resources/GetLaunchStatus/QUhTQ1RYNjUuT2ZmaWNlIC0gQWNjZXNzIDIwMTAgLSBTb3V0aA--",
			"launchurl": "Resources/LaunchIca/QUhTQ1RYNjUuT2ZmaWNlIC0gQWNjZXNzIDIwMTAgLSBTb3V0aA--.ica",
			"name": "Access 2010",
			"path": "\\Office\\",
			"shortcutvalidationurl": "Resources/ValidateAppShortcutLaunch/QUhTQ1RYNjUuT2ZmaWNlIC0gQWNjZXNzIDIwMTAgLSBTb3V0aA--",
			"subscriptionurl": "Resources/Subscription/QUhTQ1RYNjUuT2ZmaWNlIC0gQWNjZXNzIDIwMTAgLSBTb3V0aA--"
		},
	]
This call returns a list of all the resources for which you have access. The counters important to this call are:
Citrix Receiver for Web\List resources Average Time (microseconds)
Citrix Dazzle Resources Controller\List Whole Body Calls / second
Citrix Dazzle Resources Controller\List Whole Body Average Time (Microseconds)
Citrix Delivery Services Web Application(authservice:tokenservices:post:_citrix_authentication)\Controller Action Calls / second
Citrix Delivery Services Web Application(dazzleresources:list:get:_citrix_store)\Controller Action Calls / second
Citrix Delivery Services Web Application(authservice:tokenservices:post:_citrix_authentication)\Controller Action Average Time (Microseconds)
Citrix Delivery Services Web Application(dazzleresources:list:get:_citrix_store)\Controller Action Average Time (Microseconds)
Citrix Receiver for Web\List resources Calls / second
Citrix Xml Service Communication(10.10.10.11)\Network Traffic Calls / second
Citrix Xml Service Communication(10.10.10.11)\Network Traffic Average Time (Microseconds)
Citrix Xml Service Communication(10.10.10.12)\Network Traffic Calls / second
Citrix Xml Service Communication(10.10.10.12)\Network Traffic Average Time (Microseconds)
Citrix Xml Service Communication(10.10.10.13)\Network Traffic Calls / second
Citrix Xml Service Communication(10.10.10.13)\Network Traffic Average Time (Microseconds)
Citrix Xml Service Communication(10.10.10.14)\Network Traffic Calls / second
Citrix Xml Service Communication(10.10.10.14)\Network Traffic Average Time (Microseconds)
Citrix Xml Service Communication(&5.bottheory.local)\Network Traffic Calls / second
Citrix Xml Service Communication(&5.bottheory.local)\Network Traffic Average Time (Microseconds)
Citrix Xml Service Communication(XenApp65t.bottheory.local)\Network Traffic Calls / second
Citrix Xml Service Communication(XenApp65t.bottheory.local)\Network Traffic Average Time (Microseconds)
We have lots of exciting things happening here. We're reaching back and querying the XML brokers, some kind of authentication occurs, etc.
The results of these counters were:
Citrix Receiver for Web\List resources Average Time (microseconds) : 249,172
Citrix Dazzle Resources Controller\List Whole Body Calls / second : 1
Citrix Dazzle Resources Controller\List Whole Body Average Time (Microseconds) : 182,206
(authservice:tokenservices:post:_citrix_authentication)\Controller Action Calls / second : 1
(dazzleresources:list:get:_citrix_store)\Controller Action Calls / second : 2
(authservice:tokenservices:post:_citrix_authentication)\Controller Action Average Time (Microseconds) : 4,549
(dazzleresources:list:get:_citrix_store)\Controller Action Average Time (Microseconds) : 8,391
Citrix Receiver for Web\List resources Calls / second : 1
Citrix Xml Service Communication(10.10.10.11)\Network Traffic Calls / second : 1
Citrix Xml Service Communication(10.10.10.11)\Network Traffic Average Time (Microseconds) : 0
Citrix Xml Service Communication(10.10.10.12)\Network Traffic Calls / second : 1
Citrix Xml Service Communication(10.10.10.12)\Network Traffic Average Time (Microseconds) : 36,820
Citrix Xml Service Communication(10.10.10.13)\Network Traffic Calls / second : 1
Citrix Xml Service Communication(10.10.10.13)\Network Traffic Average Time (Microseconds) : 37,622
Citrix Xml Service Communication(10.10.10.14)\Network Traffic Calls / second : 1
Citrix Xml Service Communication(10.10.10.14)\Network Traffic Average Time (Microseconds) : 43,121
Citrix Xml Service Communication(&5.bottheory.local)\Network Traffic Calls / second : 1
Citrix Xml Service Communication(&5.bottheory.local)\Network Traffic Average Time (Microseconds) : 95,575
Citrix Xml Service Communication(XenApp65t.bottheory.local)\Network Traffic Calls / second : 1
Citrix Xml Service Communication(XenApp65t.bottheory.local)\Network Traffic Average Time (Microseconds) : 149,888
With these counters we can see how long it took the brokers to respond. My broker that has a few hundred applications took the longest, followed by a broker of an older farm with dozens of apps, then three where only a single app each is published from them. I got a 0.0 for enumeration for one service. I'm not sure what that's about (maybe it exceeded enumeration timeout and is now excluded?). Total time to list resources was 0.249 seconds.
$stage = “Get User Name”
$store + “Authentication/GetUserName”
Response:
Trentent Tye
This call simply returns your display name (or logon name if no display name is specified).
Two counters were hit:
Citrix Delivery Services Web Application(authservice:tokenservices:post:_citrix_authentication)\Controller Action  Calls / second
Citrix Delivery Services Web Application(tokenvalidation:tokenvalidation:get:_citrix_authentication)\Controller Action Average Time (Microseconds)
Citrix Delivery Services Web Application(authservice:tokenservices:post:_citrix_authentication)\Controller Action Average Time (Microseconds)
The results of these counters were:
(tokenvalidation:tokenvalidation:get:_citrix_authentication)\Controller Action  Calls / second : 2
(authservice:tokenservices:post:_citrix_authentication)\Controller Action  Calls / second : 1
(tokenvalidation:tokenvalidation:get:_citrix_authentication)\Controller Action Average Time (Microseconds) : 2,200
(authservice:tokenservices:post:_citrix_authentication)\Controller Action Average Time (Microseconds) : 4,551
$stage = “AllowSelfServiceAccountManagement”
$store + “ExplicitAuth/AllowSelfServiceAccountManagement”
Response:
<?xml version="1.0" encoding="UTF-8"?>
<SelfServiceAccountManagementStatus xmlns="http://citrix.com/delivery-services/webAPI/3-7/selfServiceAccountManagementStatus">
  <AllowSelfServiceAccountManagement>False</AllowSelfServiceAccountManagement>
</SelfServiceAccountManagementStatus
This call appears to return True or False.
Citrix Delivery Services Web Application(selfserviceaccountmanagement:allowselfserviceaccountmanagement:get:_citrix_authentication)\Controller Action  Calls / second
Citrix Delivery Services Web Application(selfserviceaccountmanagement:allowselfserviceaccountmanagement:get:_citrix_authentication)\Controller Action Average Time (Microseconds)
Citrix Delivery Services Web Application(authservice:tokenservices:post:_citrix_authentication)\Controller Action Average Time (Microseconds)
Citrix Delivery Services Web Application(authservice:tokenservices:post:_citrix_authentication)\Controller Action  Calls / second
The results of these counters were:
(selfserviceaccountmanagement:allowselfserviceaccountmanagement:get:_citrix_authentication)\Controller Action  Calls / second : 2
(selfserviceaccountmanagement:allowselfserviceaccountmanagement:get:_citrix_authentication)\Controller Action Average Time (Microseconds) : 2,247
(authservice:tokenservices:post:_citrix_authentication)\Controller Action  Calls / second : 1
(authservice:tokenservices:post:_citrix_authentication)\Controller Action Average Time (Microseconds) : 6,014
$stage = “Download all the icons”
$store + $iconurl
Response:
<downloads all icon files>
This call hits the following counters:
Citrix Receiver for Web\Get icon Average Time (Microseconds)
Citrix Receiver for Web\Get icon Calls / second
The results of these counters were:
Citrix Receiver for Web\Get icon Average Time (Microseconds) : 285.351
Citrix Receiver for Web\Get icon Calls / second : 152.259
$stage = “ICA Launch.GetLaunchStatus”
$store + $appToLaunch.launchstatusurl
Response:
{"fileFetchUrl":null,"status":"success"}
This call hits the following counters:
Citrix Receiver for Web\Get launch status Calls / second
Citrix Receiver for Web\Get launch status Average Time (Microseconds)
Citrix Delivery Services Web Application(dazzleresources:launchica:post:_citrix_store)\Controller Action Calls / second
Citrix Delivery Services Web Application(dazzleresources:launchica:post:_citrix_store)\Controller Action Average Time (Microseconds)
Citrix Xml Service Communication(10.10.10.11)\Network Traffic Calls / second
Citrix Xml Service Communication(10.10.10.11)\Network Traffic Average Time (Microseconds)
The results of these counters were:
Citrix Receiver for Web\Get launch status Calls / second : 1
Citrix Receiver for Web\Get launch status Average Time (Microseconds) : 152,721
Citrix Delivery Services Web Application(dazzleresources:launchica:post:_citrix_store)\Controller Action Calls / second : 1
Citrix Delivery Services Web Application(dazzleresources:launchica:post:_citrix_store)\Controller Action Average Time (Microseconds) : 5,091
Citrix Xml Service Communication(10.10.10.11)\Network Traffic Calls / second:  2
Citrix Xml Service Communication(10.10.10.11)\Network Traffic Average Time (Microseconds) : 65,709
Storefront will only fetch the status for the application from the broker that the application belongs. If I run this query multiple times, hitting different brokers, the XML service communication populates more information. The information here can be useful for you to find which broker is getting hit the most by looking at the "Network Traffic Calls / second" and you can find whether it's overloaded by the "Network Traffic Average Time" being a number that grows as your load grows. As with everything, it's probably best to get some "base" numbers when load is low and then again when load is high to get your range.
$stage = “ICA Launch.LaunchIca”
$store + $appToLaunch.launchurl
Response:
[Encoding]
InputEncoding=UTF8

[WFClient]
ProxyFavorIEConnectionSetting=Yes
ProxyTimeout=30000
ProxyType=Auto
ProxyUseFQDN=Off
RemoveICAFile=yes
TransparentKeyPassthrough=Local
TransportReconnectEnabled=On
Version=2
VirtualCOMPortEmulation=On

[ApplicationServers]
Microsoft Office - Word=

[Microsoft Office - Word]
Address=10.1.1.89.52:1494
AutologonAllowed=On
BrowserProtocol=HTTPonTCP
CGPAddress=*:2598
ClientAudio=Off
DesiredColor=8
DesiredHRES=0
DesiredVRES=0
DoNotUseDefaultCSL=On
FontSmoothingType=0
HDXoverUDP=Off
InitialProgram=#Microsoft Office - Word
Launcher=WI
LaunchReference=JR4Y0nuCM8XcFYK9Vx5O+PO2dWcIJNM=
LocHttpBrowserAddress=!
LongCommandLine=
LPWD=234
NRWD=46
ProxyTimeout=30000
ProxyType=Auto
SessionsharingKey=-c17essqKrAujaDa2N
SFRAllowed=Off
SSLEnable=Off
startSCD=1496347847617
Title=Microsoft Office - Word
TransportDriver=TCP/IP
TRWD=0
TWIMode=On
UseLocalUserAndPassword=On
WinStationDriver=ICA 3.0

[Compress]
DriverNameWin16=pdcompw.dll
DriverNameWin32=pdcompn.dll

[EncRC5-0]
DriverNameWin16=pdc0w.dll
DriverNameWin32=pdc0n.dll

[EncRC5-128]
DriverNameWin16=pdc128w.dll
DriverNameWin32=pdc128n.dll

[EncRC5-40]
DriverNameWin16=pdc40w.dll
DriverNameWin32=pdc40n.dll

[EncRC5-56]
DriverNameWin16=pdc56w.dll
DriverNameWin32=pdc56n.dll
We get an ICA file. The performance counters that are important:
Citrix Delivery Services Web Application(dazzleresources:launchica:post:_citrix_store)\Controller Action Calls / second : 1
Citrix Delivery Services Web Application(dazzleresources:launchica:post:_citrix_store)\Controller Action Average Time (Microseconds) : 5,453
Citrix Receiver for Web\Get Ica file Calls / second : 1
Citrix Receiver for Web\Get Ica file Average Time (Microseconds) : 1,255,237
Citrix Xml Service Communication(10.10.10.14)\Network Traffic Calls / second : 2
Citrix Xml Service Communication(10.10.10.14)\Network Traffic Average Time (Microseconds) : 530,153
Final results:
Taking all the operations and the time it took, I sorted the list according to duration.
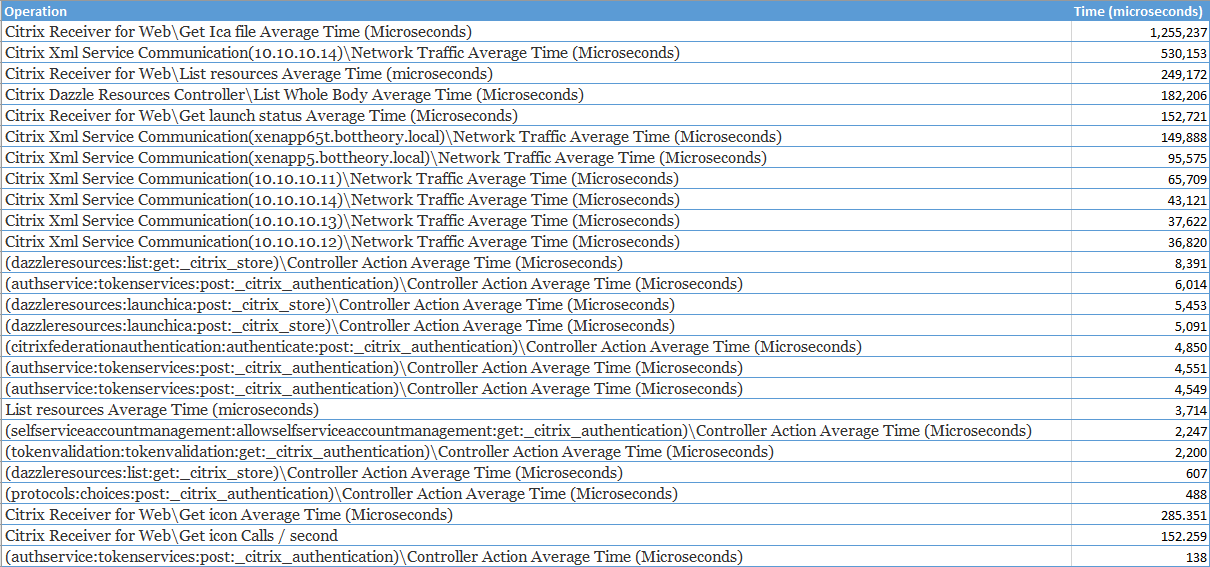
The following operations list the total duration of that specific task:
Get Ica file
List resources
List Whole Body
Get launch status
Excluding them shows us the sub-tasks that actually consumed the majority of the time spent:
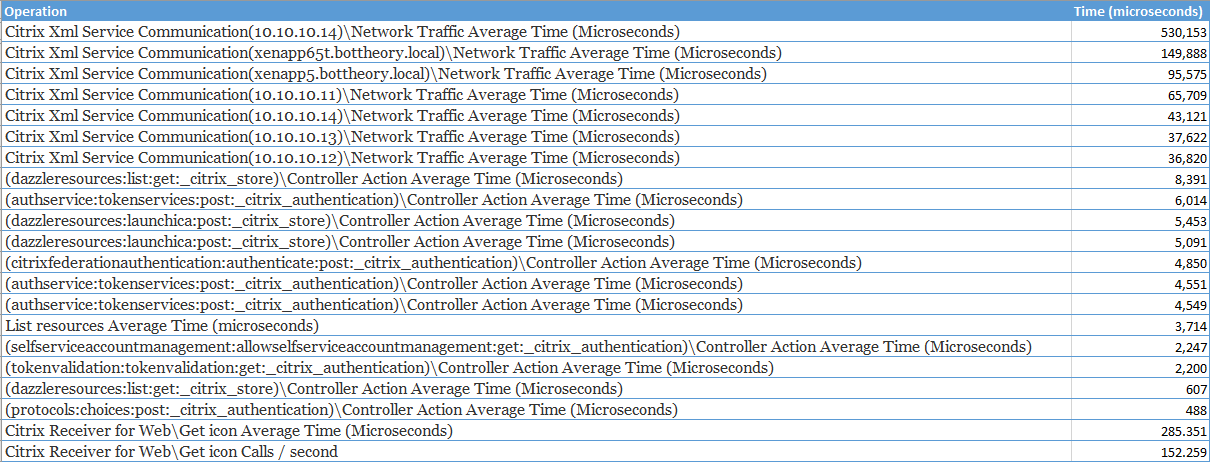
The XML communications is what consumes the majority of the processing time. The items starting in 'brackets ()' are the Citrix Storefront processing time that it spent. Being in the single "thousands" of microseconds is super fast. This essentially shows us that it takes next to no time at all for Storefront to execute the tasks that it needs.
Analysis:
Storefront has some great new performance counters that can help you determine your pain points. Access to Citrix is usually talked about in terms of 'rate' so the per-second and average time counters are excellent in helping determine what is the component taking so long to do whatever task. The breaking down of how long individual XML brokers take is a HUGE plus as you should be able to accurately gauge which Citrix FARM is now causing slowness in logon, enumeration or launching for your users.