We’re exploring upgrading our Citrix XenApp 6.5 environment to 7.X (currently 7.13) and we have some architecture decisions that are driven by the performance of the infrastructure components of &. In 6.5 these components are the “Citrix Independent Management Architecture” and in 7.13 this is the “Citrix Broker Service”. The performance I’ll be measuring is how long it takes to enumerate applications for a user. In XenApp 6.5 this is the most intensive task put on the broker. I’ve taken our existing XenApp 6.5 TEST environment and “migrated” it to 7.X. The details of the environment are 189 enabled applications with various security groups applied to each application. The user I will be testing with has access to 55 of them. What the broker/IMA service has to do when it receives the XML request is evaluate each application to see if the user has permissions and return the results. The ‘request’ is slightly different to the broker vs the IMA. This is what the FMA requests will look like:
$soap7XD = @'
<NFuseProtocol version="5.5">
    <RequestAppData>
        <Scope Traverse="subtree"></Scope>
        <DesiredDetails>permissions</DesiredDetails>
        <ServerType>all</ServerType>
        <ClientType>ica30</ClientType>
        <ClientType>rade</ClientType>
        <ClientType>content</ClientType>
        <Credentials>
            <UserName>adtest90</UserName>
            <Password encoding="ctx1">PASSWORDLOL</Password>
            <Domain type="NT">HEALTHY</Domain>
        </Credentials>
        <Clientname>LOADTESTER</Clientname>
        <ClientAddress addresstype="dot">10.10.10.10</ClientAddress>
    </RequestAppData>
</NFuseProtocol>
'
And the IMA requests:
$soap = @'
<?xml version="1.0" encoding="UTF-8"?>
<!DOCTYPE NFuseProtocol SYSTEM "NFuse.dtd">
<NFuseProtocol version="5.4">
    <RequestAppData>
        <Scope traverse="subtree"></Scope>
        <DesiredDetails>permissions</DesiredDetails>
        <ServerType>all</ServerType>
        <ClientType>ica30</ClientType>
        <ClientType>content</ClientType>
        <Credentials>
            <UserName>adtest90</UserName>
            <Password encoding="ctx1">PASSWORDLOL</Password>
            <Domain type="NT">HEALTHY</Domain>
        </Credentials>
        <ClientName>LOADTESTER</ClientName>
        <ClientAddress addresstype="dot">10.10.10.10</ClientAddress>
    </RequestAppData>
</NFuseProtocol>
'
In our environment, we have measured a ‘peak’ load of 600 concurrent connections per second to our XenApp 6.5 IMA service. We split this load over 7 servers and the load is load-balanced via Netscaler VIP’s. This lessens the peak load to 85 concurrent connections per server per second. What’s a “connection”? A connection is a request to the IMA service and a response from it. This would be considered a single connection in my definition:
This is a single request (in RED) and response (in BLUE). No further follow up is required by the client.
I’m going to profile a single response and request to better understand the individual performance of each product.
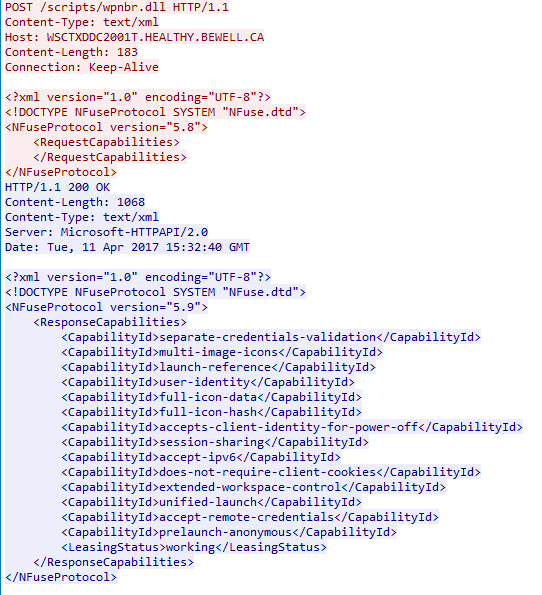
This is what my network traffic will look like (on the 7.X broker service):
POST /scripts/wpnbr.dll HTTP/1.1
Content-Type: text/xml
Host: wsctxddc2001t
Content-Length: 676
Expect: 100-continue
Connection: Keep-Alive

HTTP/1.1 100 Continue

<NFuseProtocol version="5.5">
    <RequestAppData>
        <Scope Traverse="subtree"></Scope>
        <DesiredDetails>permissions</DesiredDetails>
        <ServerType>all</ServerType>
        <ClientType>ica30</ClientType>
        <ClientType>rade</ClientType>
        <ClientType>content</ClientType>
        <Credentials>
            <UserName>adtest90</UserName>
            <Password encoding="ctx1">PASSWORDLOL</Password>
            <Domain type="NT">HEALTHY</Domain>
        </Credentials>
        <Clientname>LOADTESTER</Clientname>
        <ClientAddress addresstype="dot">10.10.10.10</ClientAddress>
    </RequestAppData>
</NFuseProtocol>HTTP/1.1 200 OK
Content-Length: 23712
Content-Type: text/xml
Server: Microsoft-HTTPAPI/2.0
Date: Tue, 11 Apr 2017 15:38:37 GMT

<?xml version="1.0" encoding="UTF-8"?>
<!DOCTYPE NFuseProtocol SYSTEM "NFuse.dtd">
<NFuseProtocol version="5.9">
    <ResponseAppData>
        <LeasingStatus>working</LeasingStatus>
        <AppDataSet>
            <Scope></Scope>
            <AppData>
                <InName>Notepad</InName>
                <FName>Notepad 2016</FName>
                <Details>
                </Details>
                <SeqNo>-1770193386</SeqNo>
                <ServerType>win32</ServerType>
                <ClientType>ica30</ClientType>
                <Permissions>
                </Permissions>
            </AppData>
            <AppData>
                <InName>Notepad 2016 - PLB</InName>
                <FName>Notepad 2016 - PLB</FName>
                <Details>
                </Details>
                <SeqNo>-2064164981</SeqNo>
                <ServerType>win32</ServerType>
                <ClientType>ica30</ClientType>
                <Permissions>
                </Permissions>
            </AppData>
... 70 applications later...
            <AppData>
                <InName>Test notepad-wsct-2</InName>
                <FName>Test notepad-wsctxapp401t</FName>
                <Details>
                </Details>
                <SeqNo>-1347715524</SeqNo>
                <ServerType>win32</ServerType>
                <ClientType>ica30</ClientType>
                <Permissions>
                </Permissions>
            </AppData>
        </AppDataSet>
    </ResponseAppData>
</NFuseProtocol>
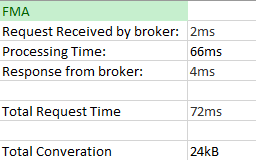
The total time between when the FMA broker receives a single request to beginning the response is:

Initial receipt of traffic at 37.567664-37.567827.
Response starts at 37.633986

Response ends at 37.634432.
Total time for FMA request for list of applications and the response for that list:
For IMA the total time between when the IMA service receives a single request to beginning response is:

Initial receipt of traffic at 38.359944-38.360198.
Response starts at 38.440197


Response ends at 38.450032.
Total time for IMA request for list of applications and the response for that list:
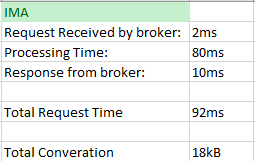
Why the size difference (18KB vs 24KB)?
Looking at the data returned from the FMA via the IMA shows there is a new field passed by the FMA broker as apart of ‘AppData’
<Permissions>
                </Permissions>
These two lines add 61 bytes per application. A standard application response is (with title) ~331 bytes per IMA application and ~400 bytes per FMA application.
However, these single request are exactly that. Single.
In order to get a better feel I ran the requests continuously in a loop, sending a request the FMA than the IMA, delay 1 second, and resend. This should get me a more accurate feel for the performance differences. I ran this over a period of 10 minutes. My results were:
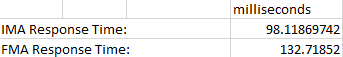
IMA is faster by approx 30ms per request.