Some discussions have swirled recently about implementing VDI. One of the challenges with VDI are things like slow boot times necessitating having machines pre-powered on, requiring a pool of machines sitting using server resources until a logon request comes in and more machines are powered on to meet the demand… But what if your boot time is measured in the seconds? Something so low you could keep the ‘pool’ of machines sitting on standby to 1 or 2 or even none!
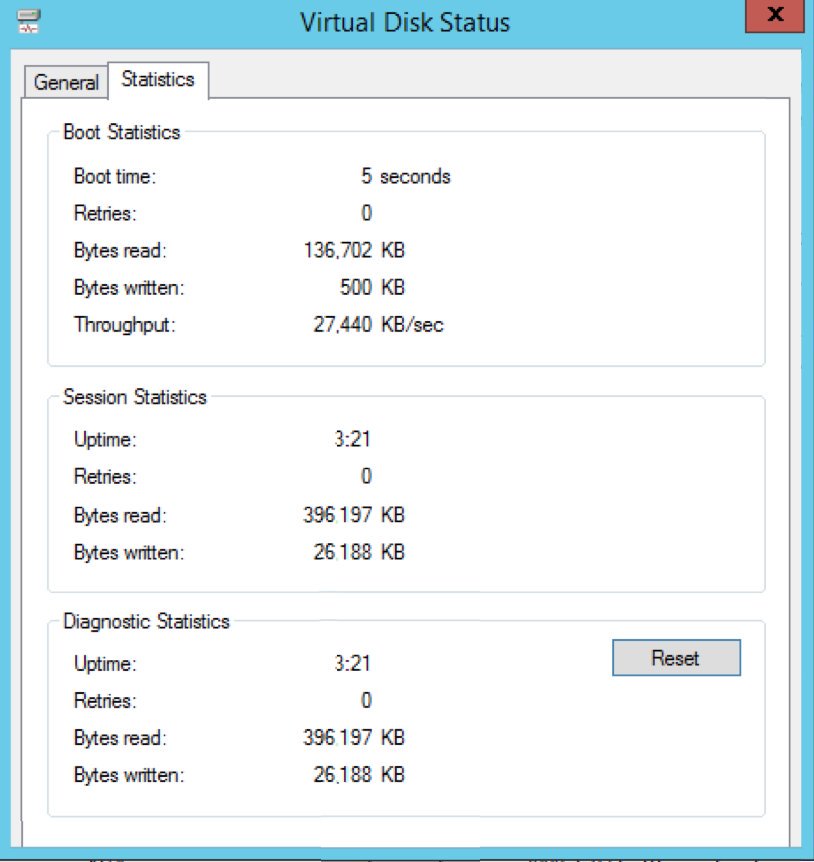
I’m interested in investigating if this is possible. I previously looked at this as a curiosity and achieved some good results:
However, that was a non-domain Server 2012 R2 fresh out of the box. I tweaked my infrastructure a bit by storing the vDisk on a RAM Disk with Jumbo Frames (9k) to supercharge it somewhat.
Today, I’m going to investigate this again with PVS 7.12, UEFI, Windows 10, on a domain. I’ll show how I investigated booting performance and see what we can do to improve it.
The first thing I’m going to do is install Windows 10, join it to the domain and create a vDisk.
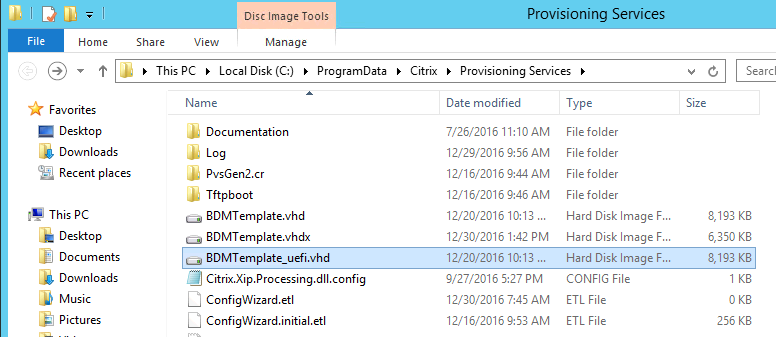
Done. Because I don’t have SCVMM setup on my home lab I had to muck my way to enabling UEFI HDD boot. I went into the PVS folder (C:\ProgramData\Citrix\Provisioning Services) and copied out the BDMTemplate_uefi.vhd to my Hyper-V target Device folder
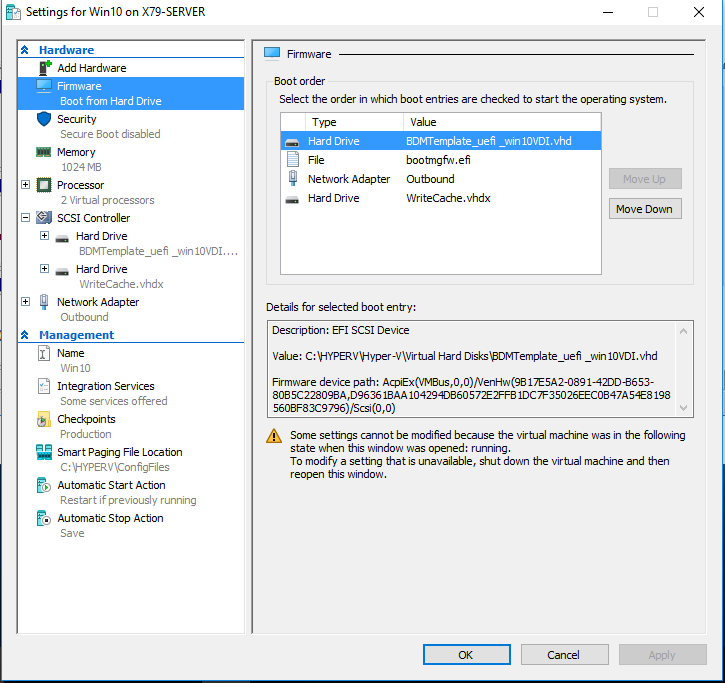
I then edited my Hyper-V Target Device (Gen2) and added the VHD:
I then mounted the VHD and modified the PVSBOOT.INI file so it pointed to my PVS server:

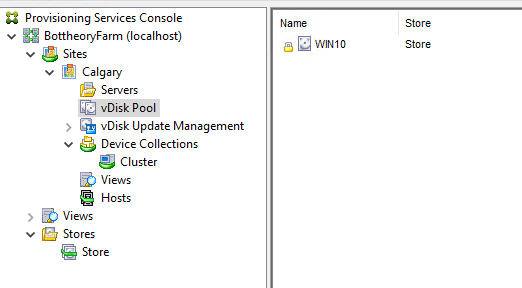
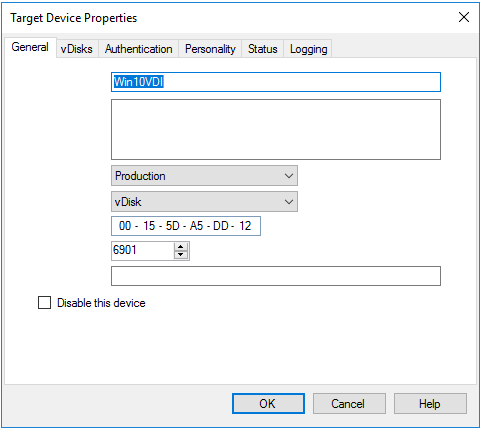
I then created my target device in the PVS console:
And Viola! It Booted.
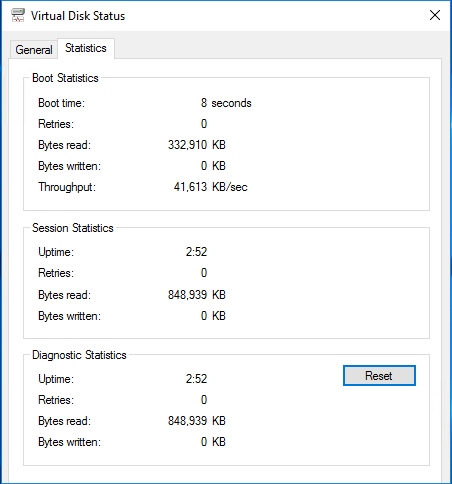
And out of the gate we are getting 8 second boot times. At this point I don’t have it set with a RAM drive or anything so this is pretty stock, albeit on really fast hardware. My throughput is crushing my previous speed record, so if I can reduce the amount of bytes read (it’s literally bytes read/time = throughput) I can improve the speed of my boot time. On the flip side, I can try to increase my throughput but that’s a bit harder.
However, there are some tricks I can try.
I have Jumbo Frames enabled across my network. At this stage I do not have them set but we can enable them to see if it helps.
To verify their operation I’m going to trace the boot operation from the PVS server using procmon:
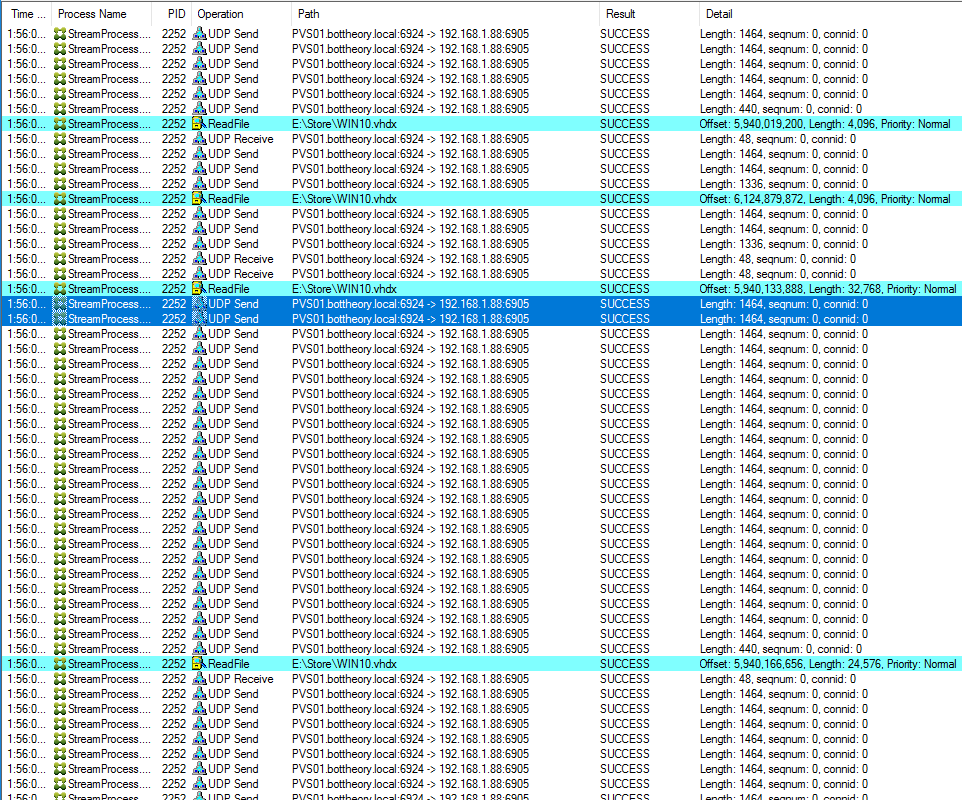
We can clearly see the UDP packet size is capping out at 1464 bytes, making it 1464+ 8 byte UDP header + 20 byte IP header = 1492 bytes. I enabled Jumbo Frames
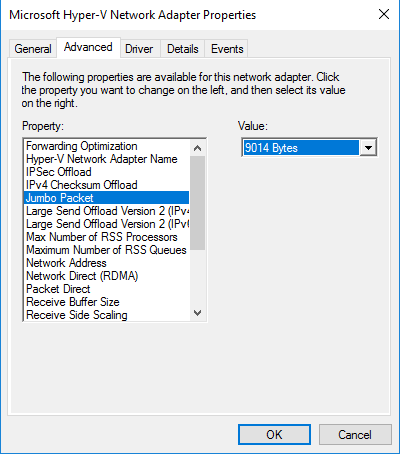
Under Server Properties in the PVS console I adjusted the MTU to match the NIC:
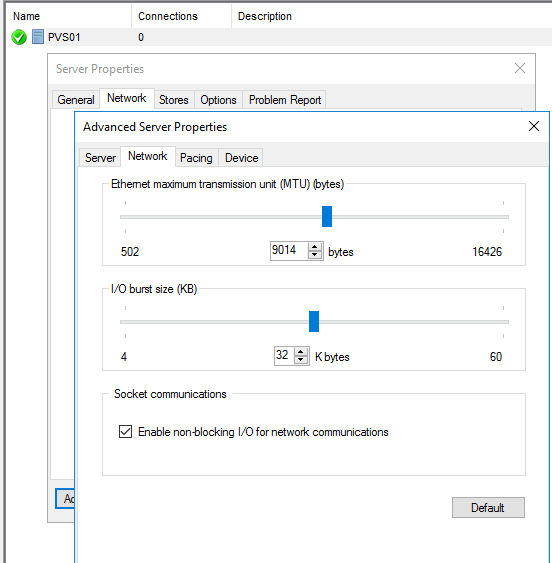
You then need to restart the PVS services for it take effect.

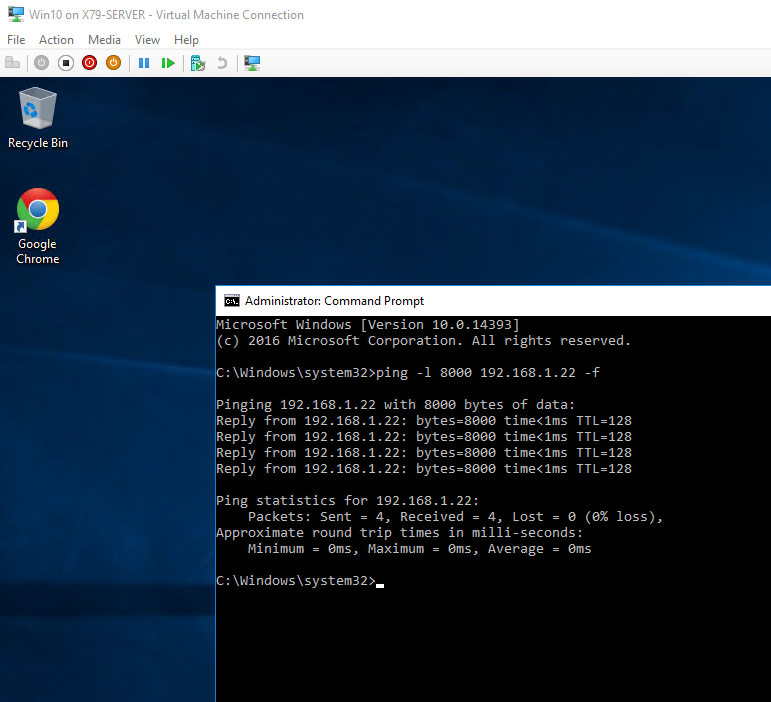
I then made a new vDisk version and enabled Jumbo Frames in the OS of the target device. I did a quick ping test to validate that Jumbo Frames are passing correctly.
I then did started procmon on the PVS server, set the target device to boot…
and…
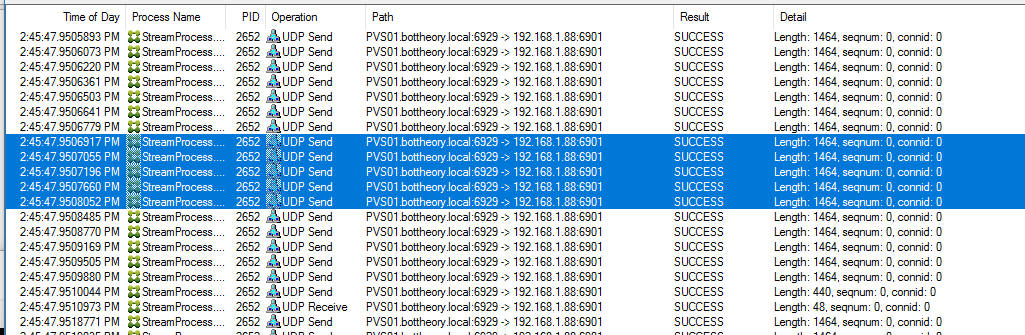
1464 sized UDP packets. A little smaller than the 9000 bytes or so it’s supposed to be. Scrolling down a little futher, however, shows:

Notice the amount of UDP packets sent in the smaller frame size?

Approximately 24 packets until it gets a “Receive” notification to send the next batch of packets. These 24 packets account for ~34,112 bytes of data per sequence. Total time for each batch of packets is 4-6ms.
If we follow through to when the jumbo frames kick in we see the following:
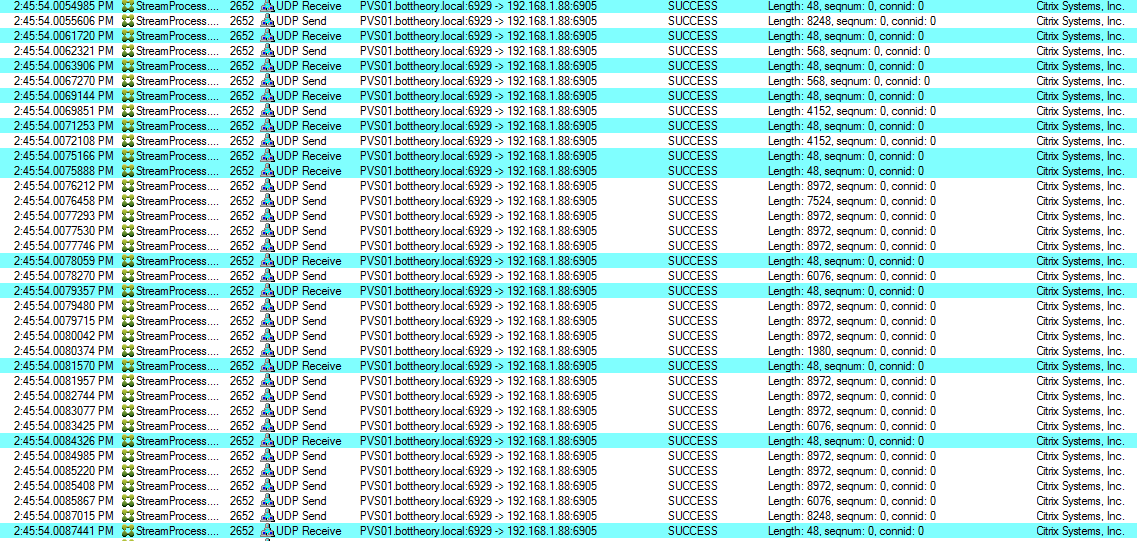
This is a bit harder to read because the MIO (Multiple Input Output) kicks in here and so there are actually two threads executing the read operations as opposed to the single thread above.
Regardless, I think I’ve hit on a portion that is executing more-or-less sequentially. The total amount of data being passed in these sequences is ~32,992 bytes but the time to execute on them is 1-2ms! We have essentially doubled the performance of our latency on our hard disk.
So why is the data being sent like this? Again, procmon brings some visibility here:
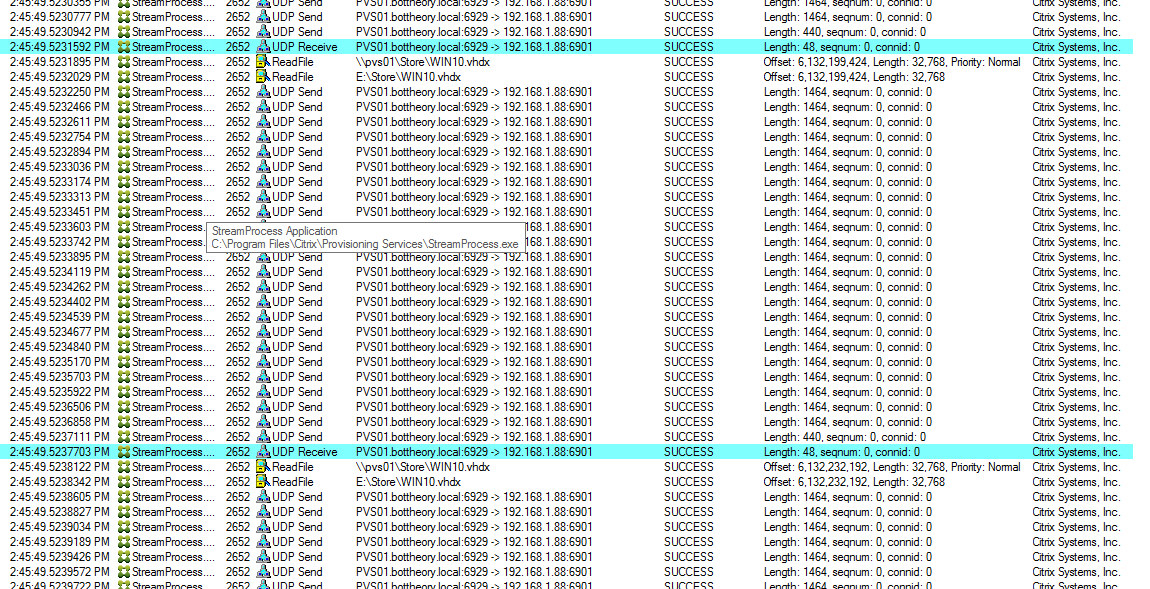
Each “UDP Receieve” packet is a validation that the data it received was good and instructs the Sream Process to read and send the next portion of the file on the disk. If we move to the jumbo frame portion of the boot process we can see IO goes all over the place in size and where the reads are to occur:

So, again, jumbo frames are a big help here as all requests under 8K can be serviced in 1 packet, and there are usually MORE requests under 8K then above. Fortunately, Procmon can give us some numbers to illustrate this. I started and stopped the procmon trace for each run of a Network Boot with Jumbo Frames and without:

Standard MTU (1506)
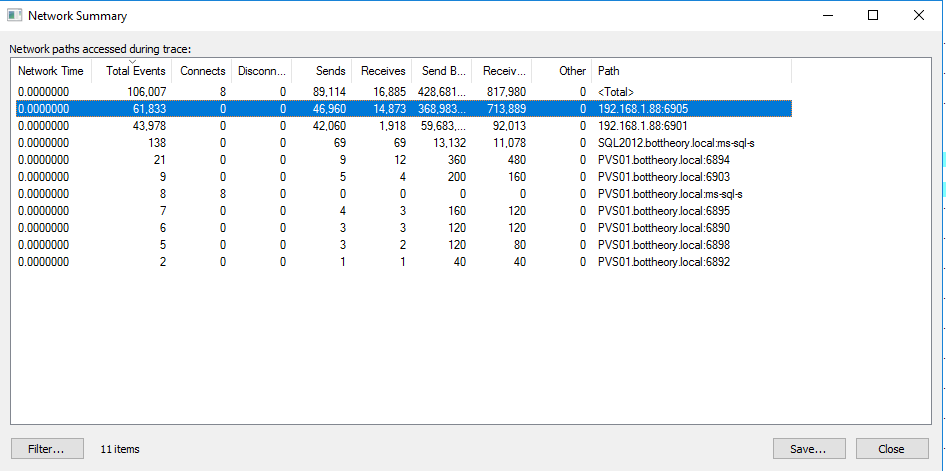
Jumbo Frame MTU (9014)
The number we are really after is the 192.168.1.88:6905. The total number of events are solidly in half with the number of sends about a 1/3 less! It was fast enough that it was able to process double the amount of data in Bytes sent to the target device and bytes received from the target device!
Does this help our throughput? Yes, it does:

“But Trentent! That doesn’t show the massive gains you are spewing! It’s only 4MB/s more in Through-put!”
And you are correct. So why aren’t we seeing more gains? The issue lies with how PVS boots. It boots in two stages. If you are familiar with PVS on Hyper-V from a year ago or more you are probably more aware of this issue. Essentially, PVS breaks the boot into the first stage (bootloader stage) which starts in, essentially, a lower-performance mode (standard MTU). Once the BNIStack loads it kicks into Jumbo Packet mode with the loading of the Synthetic NIC driver. The benefits from Jumbo Frames doesn’t occur until this stage. So when does Jumbo Frames kick in? You can see it in Event Viewer.

From everything I see with Procmon, first stage boot ends on that first Ntfs event. So out of the original 8 seconds, 4 is spent on first stage boot where Jumbo Packets are not enabled. Everything after there is impacted (positively). So for our 4 seconds “standard MTU” boot, bringing that down by a second is a 25% improvement! Not small potatoes.
I intend to do more investigation into what I can do to improve boot performance for PVS target devices so stay tuned!